
Findings from Government Studies Pt. 2
It’s been over a year since my last form of government article, in which I outlined what I had learned from a purely informational sense in researching/ranking governments, promising more data analysis. Since then, I have finalized a spreadsheet that ranks 167 countries based on the combination of two indices that measure government effectiveness and health. I’ve compared this ranking against myriad factors that might determine effectiveness, to see which are most indicative of “success.”
The Process:
The two indices I’ve used are the Legatum Prosperity Index, by the Legatum Centre for World Prosperity, and World Governance Indicators, by the World Bank. The Legatum puts more of an emphasis on standard of living and the WGI on government health, so combining the two has allowed me a more balanced ranking.
I chose nine factors in which to set the ranking against, including some that overlapped as to remove bias from individual sources. Some, like the Democracy Index Score, have significant overlap with the factors within the indices, but it serves the purpose of isolating those factors so that greater analysis can be made with them.
The Factors:
The first factor I found was the Democracy Index Score, a by country scoring system for the prevalence of democracy from the Economic Intelligence Unit. Unsurprisingly, there was a strong direct correlation between the democracy score and good governance. Countries like Norway, Sweden and Australia were near the top for both my rankings and the EIUs, while countries like DRC and Chad were near the bottom.
There were exceptions to this correlation. UAE had a 76th percentile overall ranking while scoring only 2.7/10 on the Democracy Index. They have the highest per capita GDP in the World, and a standard of living far above average despite being a monarchy. Their economy has blossomed largely due to natural resource rents from oil reserves, but they notably have higher standard of living and education scores than others that fit that category. They are an example of the fact that we should be careful to use absolutes when finding the “best” forms of governance.
The second factor I chose was population and the third was population density. I found no correlation between higher or lower population and government rank, but a strong direct correlation between higher density and higher ranked governments. My hypothesis for this phenomenon is that the greater the density, the easier it is to trade and provide public services and education. Also, countries with higher density are usually surrounded by other nations with high density due to myriad factors, creating international trade opportunities. Notably too, island nations were on average ranked higher than their land counterparts closest to them, especially in Africa, partly because they are more likely to be tourism sites.
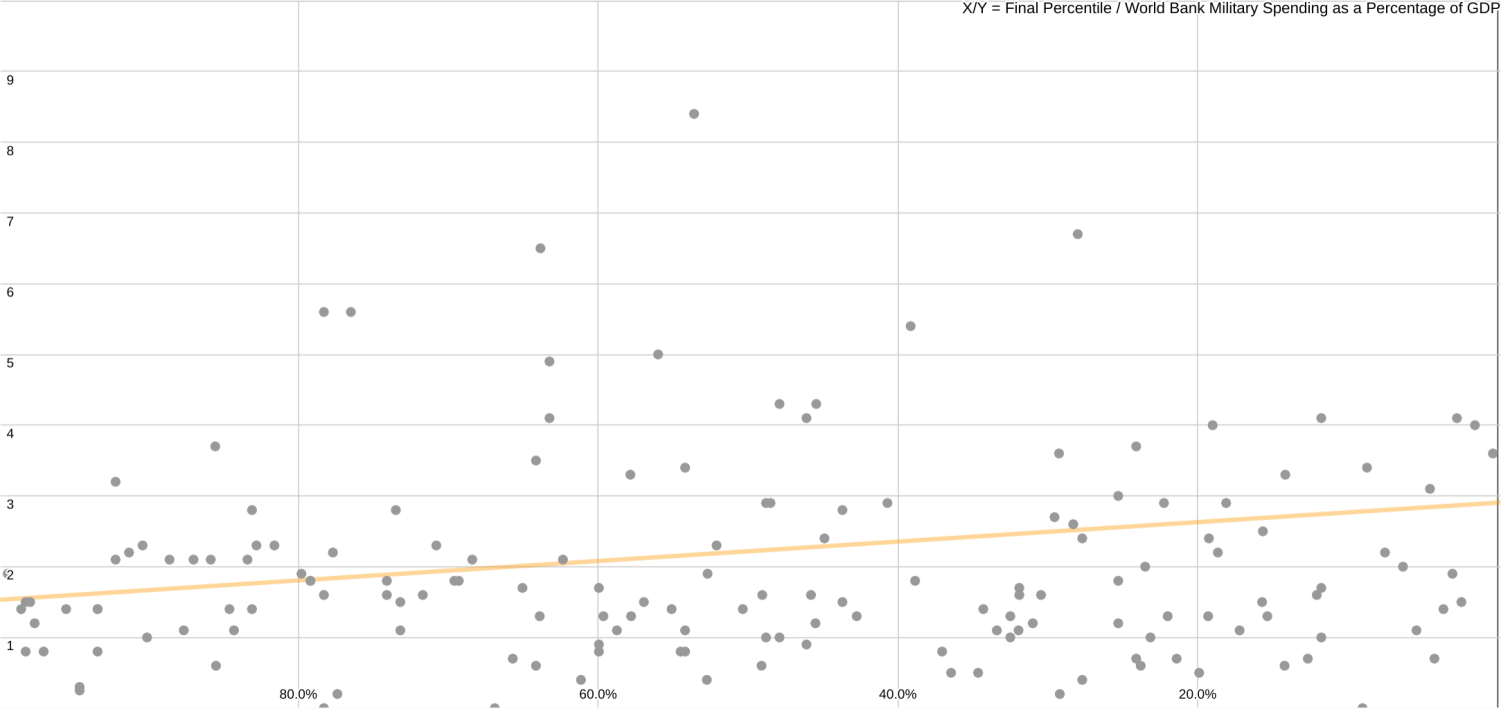
The fourth factor I chose was military spending as a percentage of GDP. I was most curious about countries like the United States, Russia, and China that are and have been in recent military offensives against weaker countries, and whether that spending had led to weaker standards of living domestically when compared to other wealthy nations that are more isolationist. But, I found this to be a complex factor, one difficult to parse out conclusions from. Governments do not report on how money they allocate to bolster their defenses vs. preparing for offensives, and the amount that must be spent on military budgets is not something that can be measured proportionally without flaw. For example, the United States spends by far the most on their military budget, but is not in the top 25 when it’s compared to GDP percentage. To illustrate this, if the U.S was to become the biggest spender, but only barely, cutting its budget from 777 billion to 225 billion (200 million more than China at 224.8 billion), they’d be at around 1.01 percent of their GDP being military spending, less than half of the global average of 2.2 percent. Poorer countries also have to spend a minimum amount on their military to keep stability, and that can come out as a higher proportion.
Still, I found a strong correlation between proportionally smaller military budgets and higher ranking governance. Of the top 50 governments, only 10% have military budgets that exceed the global average, and, despite their wealth, the United States, Russia, and China are all far from the most effective. Nearly all of the most effective governments have a combination of high GDP and low military spending.
Part 3 of this series will come in the next few weeks, in which I’ll present the other 5 factors and how they fit into my global understanding. It’s been really cool to do this research and develop a wider frame of thinking, and I hope to provide that to those that read my work.